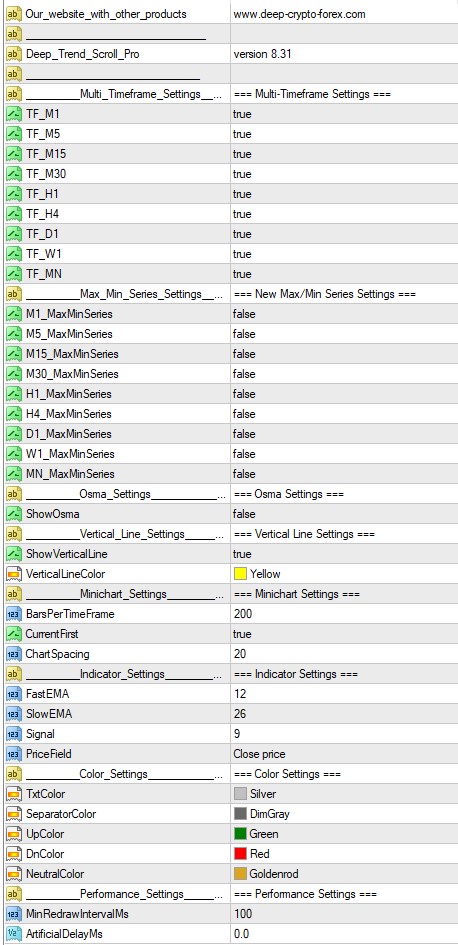
Deep Trend Scroll Pro MT4 - settings
See Deep Trend Scroll Pro on your own chart
Get the indicator and start trading with synchronized multi-timeframe context.
Download Deep Trend Scroll Pro Indicator MT4 FREE
Deep Trend Scroll Pro Indicator — Professional Market Intelligence for Stock Market, Crypto and Forex Traders
Multi-Timeframe Indicator with Synchronized Navigation. All timeframes scroll simultaneously through historical data and remain synchronized in real time.
What the Indicator Shows
Deep Trend Scroll Pro displays every configured timeframe — from M1 up to MN — as a row of synchronized mini momentum charts below your main chart. All panels scroll and update together, so you always see the same moment in time across every timeframe at once.
Synchronized Multi-Timeframe Scroll
M1, M5, M15, M30, H1, H4, D1, W1 and MN panels scroll through history together and stay perfectly aligned in real time.
Vertical Sync Line with Time & Date
One vertical line marks the exact same bar time on the main chart and on every timeframe panel, with time/date labels scaled to each panel.
Max/Min Series Modes
Choose base mode (every new extreme colored) or series mode (only unbroken runs of new extremes) independently for each of the 9 timeframes.
Osma Mode
ShowOsma parameter selects the underlying oscillator: the raw MACD line, or OsMA — the difference between MACD and its Signal line.
Tester Speed Control
ArtificialDelayMs adds a manual per-tick delay so the Strategy/Indicator Tester stays usable even at maximum slider speed.
MACD-Based Momentum Engine
Built on a configurable Fast/Slow EMA and Signal engine, coloring each bar by trend direction — bullish, bearish or neutral.
Synchronized Scroll & the Vertical Time Line
This is the core of Deep Trend Scroll Pro. Every timeframe panel is driven by the same bar time, so you never have to guess which lower-timeframe bar belongs to which higher-timeframe bar — the indicator shows you exactly.
| One shared clock | All panels (M1–MN) scroll through history together. Moving the chart moves every mini timeframe at once — nothing can drift out of sync. |
|---|---|
| Vertical sync line | A single vertical line is drawn on the main chart and inside every timeframe subwindow at the exact same bar time. Wherever you place it, that instant is marked identically on M1, M5, M15… up to MN. |
| Know exactly which bar is which | Because the line marks the same timestamp everywhere, you can read off, at a glance, which M1 bar sits inside the current M5 bar, which M5 bars sit inside the current H1 bar, and so on, all the way up to MN. |
| Time & date on every panel | Each panel prints its own bar time in a format that fits its scale: seconds on M1, minutes on M5–M30, date&time on H1/H4, and full date on D1, W1 and MN — so the exact date and time of any bar, on any timeframe, is always on screen. |
| Works live and in history | In real time, the line locks to the current forming bar on the live edge of the chart. When you scroll back through history, it automatically re-anchors to the rightmost visible bar on the main chart and instantly re-synchronizes every mini timeframe panel to that same bar — so the cross-timeframe alignment stays exact no matter where you are in history. |
How the Bar Colors Are Decided
The indicator tracks new extremes inside the current zone using the following rules:
| Green bar | Momentum > 0 AND this bar is a new high since momentum last crossed above zero. |
|---|---|
| Red bar | Momentum < 0 AND this bar is a new low since momentum last crossed below zero. |
| Gold bar | Same zone, but not a new extreme — a pullback or fading push. |
| Zone reset | Crossing zero resets the running high/low, so the next qualifying bar becomes green or red again. |
Max/Min Series Settings
Every timeframe has its own independent _MaxMinSeries switch (M1_MaxMinSeries … MN_MaxMinSeries), which changes exactly how strict the green/red coloring rule is on that panel:
Max/Min Series - Off (default)_______________________________________ Max/Min Series - On
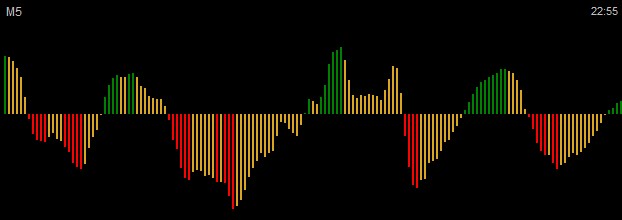
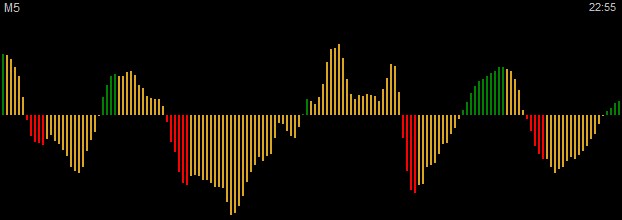
| Off (default) | Base mode — every bar that beats the running high (or low) of the current zone is colored, even if the previous bar wasn't a new extreme. Momentum can pause and still light up again on the next fresh push. |
|---|---|
| On | Series mode — only an unbroken run of consecutive new highs (or lows) stays colored. The moment a bar fails to beat the running extreme, tracking stops for that zone and every bar after it is neutral (gold) until momentum crosses zero and a new zone starts. |
| Per-timeframe control | M1 can run in Series mode while H1 stays in base mode, or any other combination — each of the 9 timeframes decides independently. |
Osma Settings
The ShowOsma switch changes what value actually drives the histogram bars:
| ShowOsma = false (default) | Bars plot the raw MACD value (Fast EMA − Slow EMA). |
|---|---|
| ShowOsma = true | Bars plot OsMA instead — the MACD value minus its own Signal line (an EMA of the MACD), giving a more responsive, oscillator-style read of momentum acceleration rather than raw trend value. |
| Same coloring rules apply | Whichever source is selected, the green/new-high, red/new-low and gold/pullback logic above is applied to it identically. |
ArtificialDelayMs — Fixing the Strategy Tester Speed Slider
Anyone who has backtested with indicators in MT4 knows the problem: drag the Strategy/Indicator Tester speed slider all the way to the right and testing becomes unusably fast — ticks fly by faster than the indicator (or your eyes) can keep up with, making visual verification on fast settings almost impossible.
| What it does | ArtificialDelayMs inserts a small, precise delay (in milliseconds, fractions allowed) into every tick the indicator processes. |
|---|---|
| ArtificialDelayMs = 0 (default) | No delay — the indicator runs at full native speed, exactly as before. |
| ArtificialDelayMs > 0 | You regain manual control over the effective test speed even with the slider maxed out — set a small value to slow ticks down to a pace you can actually follow and verify visually. |
| Why it matters | It solves the long-standing MT4 annoyance where the tester's rightmost speed setting is too fast to be usable, without forcing you to run the whole backtest at a slower slider position. |
How to Download and Install
- 1
Download the file. Get
Deep Trend Scroll Pro.ex4from the link at the bottom of this page. - 2Open the Data Folder. In MT4, go to File → Open Data Folder, then
MQL4 → Indicators. - 3Copy the file into the
Indicatorsfolder. - 4Restart MT4 (or right-click Indicators in Navigator and choose Refresh).
- 5Attach it to a chart from Navigator → Indicators.
- 6
Configure settings — The default settings are ready to go — just click OK. If you want to adjust parameters first, check the manual.
Frequently Asked Questions
How exactly are all the timeframes synchronized?
Every panel scrolls off the same shared bar clock, and the vertical sync line marks the identical bar time on the main chart and inside every mini timeframe panel — so M1–MN never drift apart, in history or in real time.
How do I know which bar time I'm looking at?
Each panel prints its own bar time in a format scaled to it — seconds on M1, minutes on M5–M30, date & time on H1/H4, and full date on D1, W1 and MN — and the vertical line ties them all to the same instant.
What's the difference between base mode and series mode (Max/Min Series)?
Base mode colors every bar that beats the running high/low of the current zone. Series mode only keeps coloring while extremes happen on consecutive bars — the moment one bar fails to beat the extreme, that zone turns neutral until momentum crosses zero. Each of the 9 timeframes sets this independently.
What does the Osma option change?
ShowOsma switches the value driving the bars from raw MACD to OsMA (MACD minus its own Signal line), giving a more responsive, acceleration-style read of momentum. The same green/red/gold coloring rules still apply.
How does ArtificialDelayMs help in the Strategy Tester?
At full tester speed, ticks fly by too fast to verify visually. ArtificialDelayMs adds a small manual delay per tick so you can slow testing down to a pace you can actually follow, without touching the tester's speed slider.
What happens if a timeframe doesn't have enough history yet?
The indicator automatically requests more history in the background with built-in retry logic, and shows an on-chart "Loading" status for that panel until the data is ready.
Will it slow down my terminal?
No. All mini timeframe panels are drawn on a single canvas bitmap instead of hundreds of chart objects, keeping CPU usage low.
Can I use it on any broker or symbol?
Yes. It works on any MT4 broker feed and any symbol — Forex, indices, crypto CFDs, metals and more.
Latest Updates
Recent improvements to Deep Trend Scroll Pro — open the block to read the full technical description of each update.
New_Max_Min_Series_Per_TF
A new optional coloring mode that is switched on individually for every timeframe. In the standard (base) logic, every histogram bar whose value exceeds the previous extreme of the current zone is colored green (above zero) or red (below zero) — including the repeated breakouts that follow a pullback inside the same wave. With New Max/Min Series enabled, a timeframe panel colors only the first uninterrupted series of new maximums (above zero) or new minimums (below zero). The first bar that fails to set a new extreme locks the zone: every following bar stays neutral gold until the histogram crosses zero.
Nine independent bool switches, one per timeframe from M1 to MN. All of them are false by default, so existing setups behave exactly as before. A timeframe with the switch off keeps the standard logic, which means series-mode and base-mode timeframes can be combined freely in one multi-timeframe configuration.
| Situation inside one zone | Base mode (default) | New Max/Min Series |
|---|---|---|
| First bar after zero cross | Colored (green / red) | Colored (green / red) |
| Each consecutive new extreme | Colored | Colored |
| Bar without a new extreme | Gold (pullback) | Gold — locked is set |
| Later breakout of the old extreme | Colored again | Stays gold until the zone changes |
| Zero cross (zone change) | Running high / low reset | Running high / low and lock reset |
History_Status_Messages
Deep Trend Scroll Pro draws up to nine timeframes at once, so every mini-chart needs enough bars on its own timeframe. Previously, when you scrolled deep into the past and a timeframe ran out of data, its panel could stay on Loading indefinitely without any explanation. Now the indicator checks why the data is missing and replaces Loading with a clear on-chart message that tells you exactly what to do. The check repeats every second, so if the history becomes available the message disappears and the histogram is drawn automatically.
| Cause | Message on the mini-chart | What to do |
|---|---|---|
| The history of this timeframe has not been downloaded | Please download history | Download the history in the terminal and restart it. |
| The number of loaded bars has reached the terminal limit | Bars limit reached (N bars)Tools > Options > Charts: increase max bars in history and in chart and restart the terminal | Open Tools → Options → Charts, increase both limits and restart the terminal. |
N in the second message is the number of bars currently loaded on that timeframe. The messages are shown separately for each mini-chart, so one timeframe can show a warning while the others keep working normally.
See Deep Trend Scroll Pro on your own chart
Get the indicator and start trading with synchronized multi-timeframe context.
Download Deep Trend Scroll Pro Indicator MT4 FREE